
Housing inequality for seniors in Illinois
We partnered with housing researchers to analyze repair needs and lending patterns for senior homeowners across Illinois. Here's what the data shows.
Statewide In Illinois
Statewide
570,000
Low-income Illinois homeowners aged 62 and older
83.2%
Have held the same home for ten years or more
17,250
Additional homeowners are 55 and older with a disability
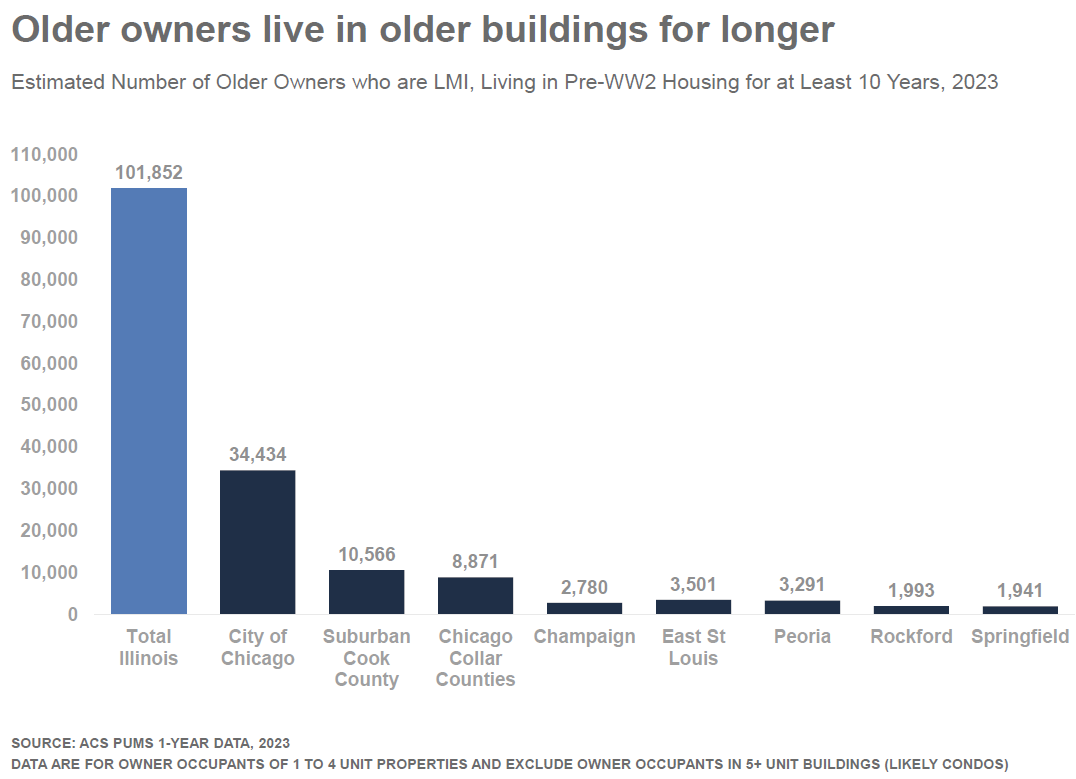
Nearly one in five Illinois homeowners is a senior living on a low income.
That's close to 570,000 people in one- to four-unit homes across the state — and more than eight in ten have held the same house for a decade or longer.
This isn't a narrow case at the margins. It's a large share of Illinois homeowners, and they're the ones who stayed.
In Chicago
In Chicago
6,818
Homeowners sought repair help in an eleven-day window in 2025
250–300
Households the city expected to serve that year
4%
Share of those who asked who could be reached
Over 70%
Of one- to four-unit properties claiming a senior exemption are in communities of color
When Chicago opened registration for its home repair program in March 2025, 6,818 homeowners applied or called in eleven days.
The city expected to reach 250 to 300 of them. The following year it didn't open registration at all — the backlog was already too long. The need didn't go away. People just stopped being counted.
Nationwide Data
Illinois isn't an outlier. Harvard's Joint Center for Housing Studies finds the same pattern across the country: the nation's housing stock is the oldest on record, and the oldest homes are disproportionately owned by people in the lowest income bracket — who spend roughly a third of what wealthy owners spend keeping a house standing.
The result is measurable. Homes built before 1960 are four times more likely to have failing plumbing, wiring, heat, or a leaking roof.

Figure 1
Where the money goes
What owners spend on depends on how old the house is. On pre-1960 homes, most of the budget goes to maintenance and to replacing roofs, siding, furnaces and wiring — work that can’t be postponed. On homes built since 2010, a third of spending goes to landscaping, fencing and decks. One group is improving a house. The other is holding one together.

Figure 2
Who can afford it
Repair spending tracks income far more closely than it tracks need. Within every building-age group, the highest-earning fifth of homeowners outspends the lowest by three to one. The gap is widest on the oldest homes, which are the ones that need the most work.

Figure 3
What happens when repairs don’t happen
Deferred maintenance eventually shows up as physical failure. More than 1.1 million owner-occupied homes built before 1960 are classified as inadequate — water leaks, holes in the floor, failing plumbing, electrical or heat. That’s 5.4% of them, against 1.3% of homes built since 2010.
Source: Harvard Joint Center for Housing Studies tabulations of HUD’s 2023 American Housing Survey.
Explore the interactive dashboard
Track loan applications, approval and denial rates, and county-level need in detail.